India Manufacturing GVA Rises 9.28%: ASI Report
India Manufacturing GVA Rises 9.28%: ASI Report
India’s manufacturing sector recorded notable growth in value addition during FY 2024–25, according to the Annual Survey of Industries (ASI) 2024–25 results released by the Ministry of Statistics and Programme Implementation (MoSPI) on 4 November 2026.
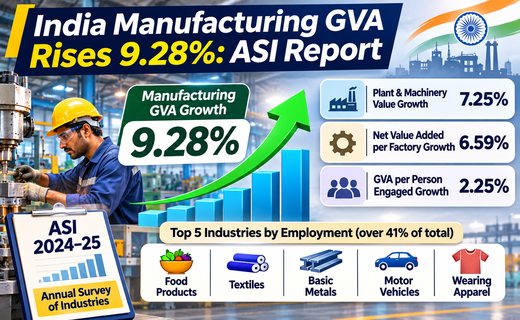
The India Manufacturing GVA figures show that gross value added in the manufacturing corporate sector increased by 9.28% compared with the previous financial year.
The findings provide insights into factory investment, productivity, employment and the industries supporting India’s manufacturing economy.
India Manufacturing GVA: Key Findings From ASI 2024–25
The official government announcement highlights changes in several industrial indicators.
| Indicator | Reported growth |
|---|---|
| Manufacturing corporate-sector GVA | 9.28% |
| Value of plant and machinery | 7.25% |
| Net value added per factory | 6.59% |
| GVA per person engaged | 2.25% |
These figures describe different aspects of industrial performance and should not be interpreted as interchangeable measures of overall manufacturing growth.
The 9.28% increase specifically relates to manufacturing corporate-sector GVA, rather than the entire economy’s manufacturing output.
What Is Gross Value Added in Manufacturing?
Gross value added measures the value created through production after deducting the cost of goods and services used as inputs.
For example, a factory may purchase raw materials, manufacture finished products and sell them at a higher value. The difference, after accounting for intermediate inputs, contributes to its gross value added.
GVA helps explain how much productive activity contributes to the economy. However, rising GVA does not automatically mean every manufacturer earned higher profits or that employment increased at the same rate.
Factory Investment and Productivity Trends
The ASI results indicate a 7.25% increase in the value of plant and machinery.
This provides information about the industrial asset base, although it should not be treated as a direct measure of new capital expenditure.
Net value added per factory increased by 6.59%, while GVA per person engaged rose by 2.25%.
The latter indicator offers a broad view of value addition relative to the number of people engaged in industrial activity.
Productivity improvements can arise from better equipment, production methods, workforce skills and changes in industrial composition. The survey figures alone do not establish which factors caused the increases.
Five Industries Account for Over 41% of Employment
According to the MoSPI survey findings published by the Press Information Bureau, five major manufacturing industries together account for more than 41% of employment in the surveyed sector.
These are:
- Food products
- Textiles
- Basic metals
- Motor vehicles
- Wearing apparel
Their combined employment contribution highlights the importance of both traditional labour-intensive industries and larger industrial supply chains.
Food processing and textiles support extensive production networks, while metals and motor vehicles connect with infrastructure, engineering and manufacturing demand.
The employment concentration also demonstrates why developments in these industries matter for industrial jobs and regional economic activity.
Why the ASI Report Matters for India’s Economy
The Annual Survey of Industries is an important source of information about India’s organised factory sector.
Its findings help economists, policymakers and businesses examine industrial structure, production and employment patterns.
Manufacturers can use sector-level information to understand changes in industrial activity, while researchers can compare developments across financial years.
Investors may also find the results useful when studying broad manufacturing trends.
Nevertheless, ASI findings are historical survey statistics. They should not be used as a substitute for current company earnings, market valuations or more recent industrial indicators.
Frequently Asked Questions
What is the India Manufacturing GVA growth rate?
The ASI 2024–25 results report 9.28% growth in manufacturing corporate-sector GVA compared with the previous financial year.
When was the ASI 2024–25 report released?
MoSPI released the results on 4 November 2026.
Does the report show manufacturing growth in FY 2026–27?
No. The results relate to FY 2024–25. The publication date does not change the reporting period.
Conclusion
The latest India Manufacturing GVA findings point to higher value addition, growth in plant and machinery value and improvements in selected factory-level productivity measures during FY 2024–25.
The results offer useful evidence about India’s industrial economy, but they should be read alongside newer economic indicators before drawing conclusions about current manufacturing conditions.
Disclaimer: This article is intended for general financial and economic information and does not constitute investment advice.